Highlights from REIQ's Queensland Market Monitor Report
Queensland Market Monitor Report for March 2017
We’ve reviewed the latest Queensland Market Monitor report and taken the key points for the Brisbane property market. We’ve also included some points on the Queensland, Greater Brisbane and other Capital Citys’ market performance.
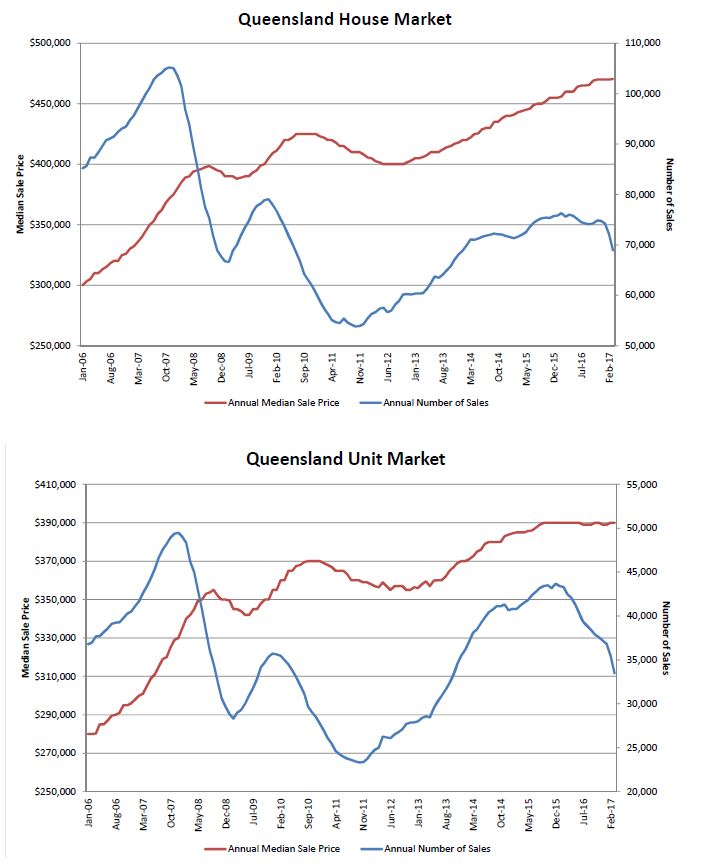
QUEENSLAND MARKET – HOUSES
- The Queensland median house price increased from $467,000 to $469,500 over the quarter
- Compared to 12 months ago, Queensland’s annual median house price increased by 3.3 per cent (this growth has largely been driven by the Gold Coast and the Sunshine Coast)
- Brisbane LGA is the most expensive house market with a median price of $642,000 for this quarter
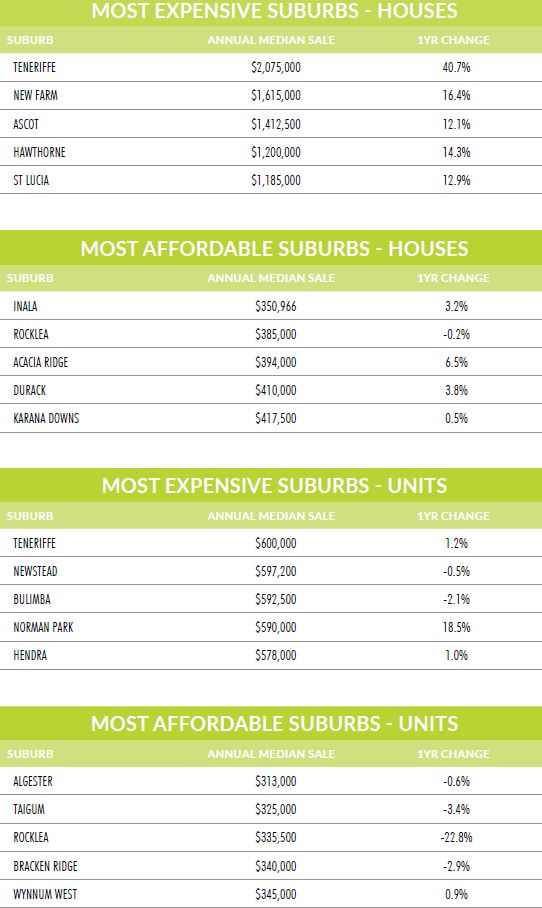
- The top performing suburbs in the state were Teneriffe and Noosa.
- Rockhampton is the most affordable house market in QLD with the median sale price for the quarter of $260,000
QUEENSLAND MARKET – UNITS
- The unit market around QLD has been soft this quarter, but there are pockets that have performed well
- Some of the top performing suburbs around Brisbane were Mount Gravatt, Norman Park and Wynnum with growth in the apartment market of 24.2%, 18.5% and 15.9% respectively over the past 12 months
- The unit market in Queensland experienced a fall of 1.03 per cent
- Noosa was the top performing unit market this quarter, with growth of 8.2% over the quarter
- Toowoomba is the top performer for growth over the past 5 years with the annual median unit price growing 25.7% from March 2012 to March 2017
- Mackay is the most affordable unit market in QLD
QUEENSLAND MARKET – RENTALS
- Brisbane LGA saw an increase in vacancy rates over the quarter to 3.7%
- Inner city Brisbane saw an increase in vacancy rates over the quarter to a new high of 4.4%
- Outer Brisbane saw vacancy rates tighten over the March quarter
- The Gold Coast is the most expensive rental market in QLD with the median rent for a three-bedroom house about $470 per week, $30 more expensive than three-bedroom houses in Brisbane LGA
- Noosa’s rental market weakened substantially over the March quarter in light of the seasonality affecting this region, finishing the March quarter with 4 per cent vacancies. This is the first time in five years that the rental market has moved into weak territory.
- The performance of the rental market in regional Queensland remained weak with vacancy rates still sitting in the weak range and generally above 6 per cent. The only exceptions were Toowoomba, Gympie, Scenic Rim and Southern Downs.
- Investors in the Cairns unit rental market are achieving the highest indicative rental yield of all markets in the Queensland Market Monitor.
Take a look at our current rentals.
Source: REIQ QMM – Queensland Market
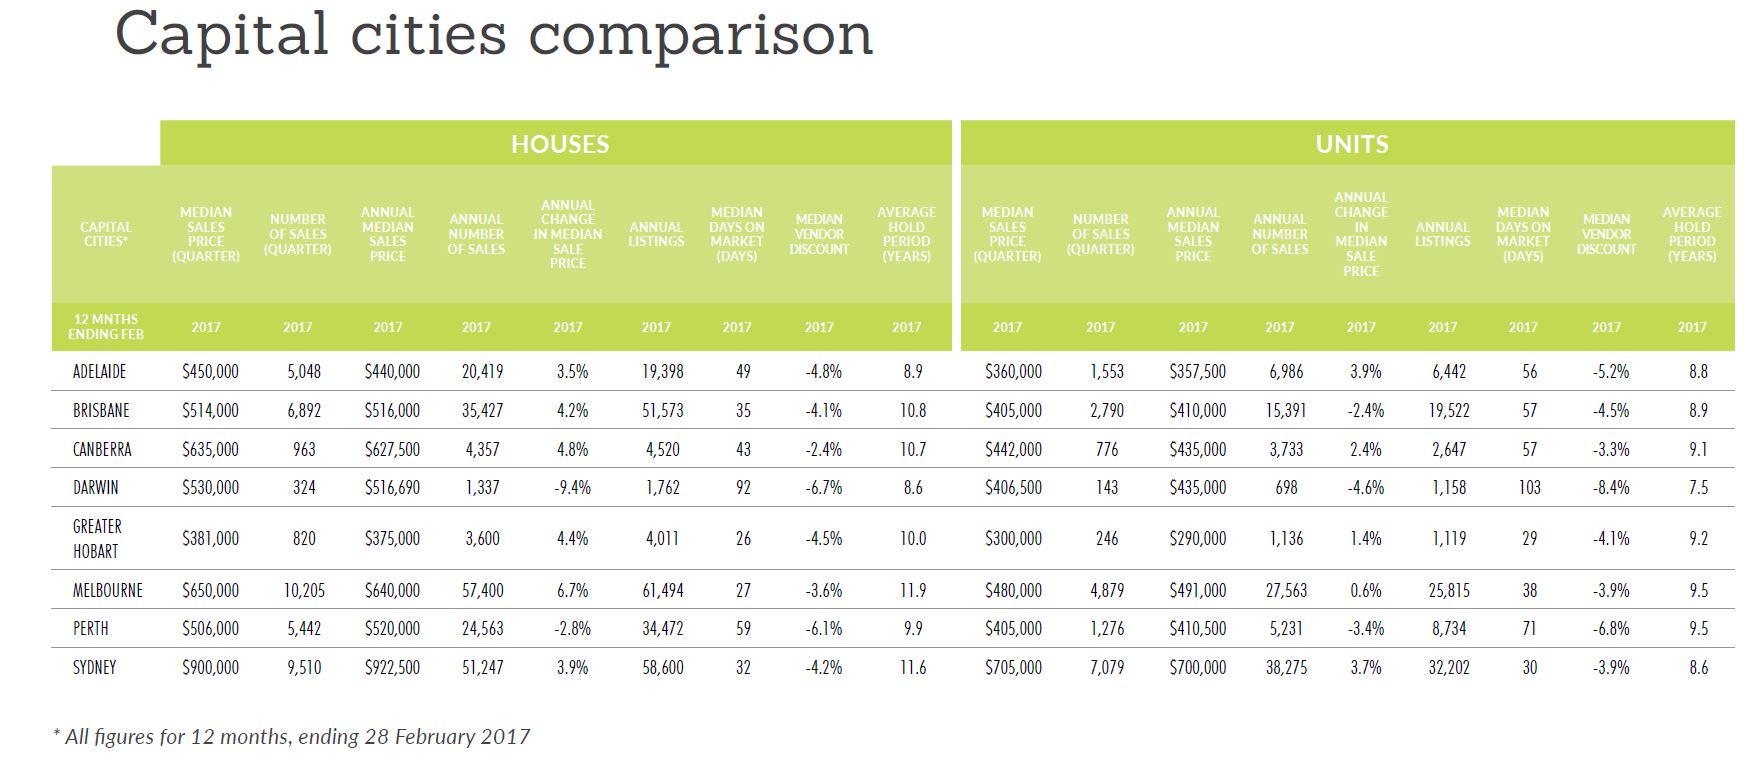
CAPITAL CITY COMPARISON
- Brisbane remains one of the most affordable capital cities in Australia
- Looking at population movements over the past 18 months, CoreLogic and ABS have revealed that net internal migration to Brisbane is the greatest it’s been in at least 10 years (the Gold and Sunshine Coasts had the highest migration from within Australia)
- The State Government’s bumped up First Home Buyer Grant has been extended to December 31. It has been a successful scheme only in the southeast corner and accounts for about 5 per cent of all Queensland property sold in the 12 months to March 2017
- All capital cities except Perth and Darwin saw an increase in their annual median house price (Melbourne was the highest at 6.7%)
- The annual median unit price performance was positive for all capital cities except Darwin, Perth and Brisbane (Adelaide’s was the highest at 3.9 percent)
- Melbourne is the largest residential house market with 57,400 sales annually, Darwin is the smallest with just 1400. Brisbane is the third-largest capital city house market in Australia with about 35,400 sales per year
- Houses sell faster in Hobart than in any other capital city with median days on market of 26, compared to the longest median days on market of 92 days in Darwin. Melbourne is just behind Hobart with an average of 27 days on the market.
- Units also sell fastest in Hobart, with an average of 29 days. The slowest market for units was Darwin, which had median days on market of 103 days
- In Canberra vendors offer the smallest discount, just 2.4% for houses and 3.3% for units. This compares to the largest vendor discount in Darwin of 6.7% for houses. Brisbane’s vendor discount is now 4.1% for houses and 4.5% for units.
Source: REIQ QMM
SPOTLIGHT ON THE BRISBANE MARKET
- Brisbane’s annual median sale price grew 4.2% to $516,000 and this is the fourth-largest growth, trailing Melbourne, Canberra and Hobart
- Brisbane LGA’s annual median house price grew 4%, from $625,000 in March 2016 to $650,000 in March 2017. Five-year cumulative growth for Brisbane LGA is 27.5% from $509,999 in March 2012
- Brisbane’s median house price to February 2017 was $514,000, making the river city the fourth-most affordable capital city in Australia
- Brisbane’s annual median unit price is $410,000 and this is about 41% more affordable than the country’s most expensive apartment market, Sydney
- Teneriffe is Brisbane’s first $2 million suburb. This suburb has experienced growth of 40.7% over the past 12 months
- House prices in inner-Brisbane increased significantly over the past 15 months due to an increase in demand from owner-occupiers. Brisbane has at least 15 suburbs with an annual median sale price above $1 million for houses compared to only 10 suburbs in December 2016 and seven suburbs in March 2016.
- The most popular price range in Brisbane LGA is from $500,000 to $750,000
- A house in Brisbane LGA sells in around 30 days, with a discount of about 4.1 per cent.
- The average number of days on the market for Greater Brisbane and Brisbane LGA houses was 35
- Compared to the house market, units consistently took longer to sell and required a higher vendor discount
- The supply of houses in Brisbane LGA is growing, with the number of listings increasing by 16.4 per cent from 18,792 in February 2016 to 21,883 listings in February 2017
- The supply of units has exploded with 40% more listings in February 2017 compared with February 2016. Despite this, the number of sales fell and it’s taking loner for units to sell – on average 54 days to sell a unit, compared to 40 days for the previous year
- Brisbane-ites love their properties and hang onto them for the third-longest period, 10.8 years (houses)
- Brisbane LGA vacancy rate has increased over the March quarter to 3.7%
- Brisbane inner-city vacancy rate reached a record high of 4.4 per cent this quarter, the highest in the region
- Despite the increasing vacancies, the median rent for three-bedroom houses and three-bedroom townhouses increased by $15 and $10 to $440 and $420 per week
Source: REIQ QMM
Check out our available properties for sale.
The Queensland Market Monitor is a quarterly report presenting national, state, local government area, capital city and suburb-by-suburb residential sales and rental data.
Published by the Real Estate Institute of Queensland, this report includes median house and unit price data, rental research and on-the-market statistics – everything you need to know about Queensland real estate, in one report!
You can subscribe to the REIQ’s Queensland Market Monitor here.